Modern system monitoring: how to achieve great success with minimal effort
Be honest: how often do you check the yields of the photovoltaic systems you have installed? On the first day of installation? When you hand over the installation to the customer? When you receive an error message? Or are you the type of installer that regularly checks Fronius Solar.web, even after the systems have been successfully commissioned? If you are, then congratulations – you are perfectly equipped for the future of the industry. But if you belong to the first group, that’s also not a problem. After reading this article you will be ready to take the bull by the horns and become an analysis expert. In this article, we will lay out eight reasons why modern system monitoring is the key to customer support and acquiring repeat business.

IF YOU ARE NOT FAMILIAR WITH THE BASIC FUNCTIONS OF SYSTEM MONITORING, PLEASE READ ON!
If you need a quick refresher, this section will also be of interest to you.
If you are already a PV analysis expert, feel free to skip this part and continue reading below.
The basic set-up of every modern PV system includes Fronius inverters with an integrated Datamanager, Smart Meter and the Solar.web online portal. This combination makes it easy to monitor, analyse and compare the system data. Datamanager 2.0 is integrated into every modern Fronius SnapINverter as standard. It can also be easily retrofitted to older inverter models to provide exactly the same functions. Once Datamanager 2.0 is connected to the internet via an Ethernet or WLAN connection, it sends real-time data from the PV system directly to Fronius Solar.web. We will explain the functions of Solar.web in more detail under point 2.

8 REASONS WHY MODERN SYSTEM MONITORING WILL MAKE YOU MORE SUCCESSFUL
1) THE ABILITY TO NETWORK THE PV SYSTEM WITH OTHER SYSTEMS USING OPEN INTERFACES
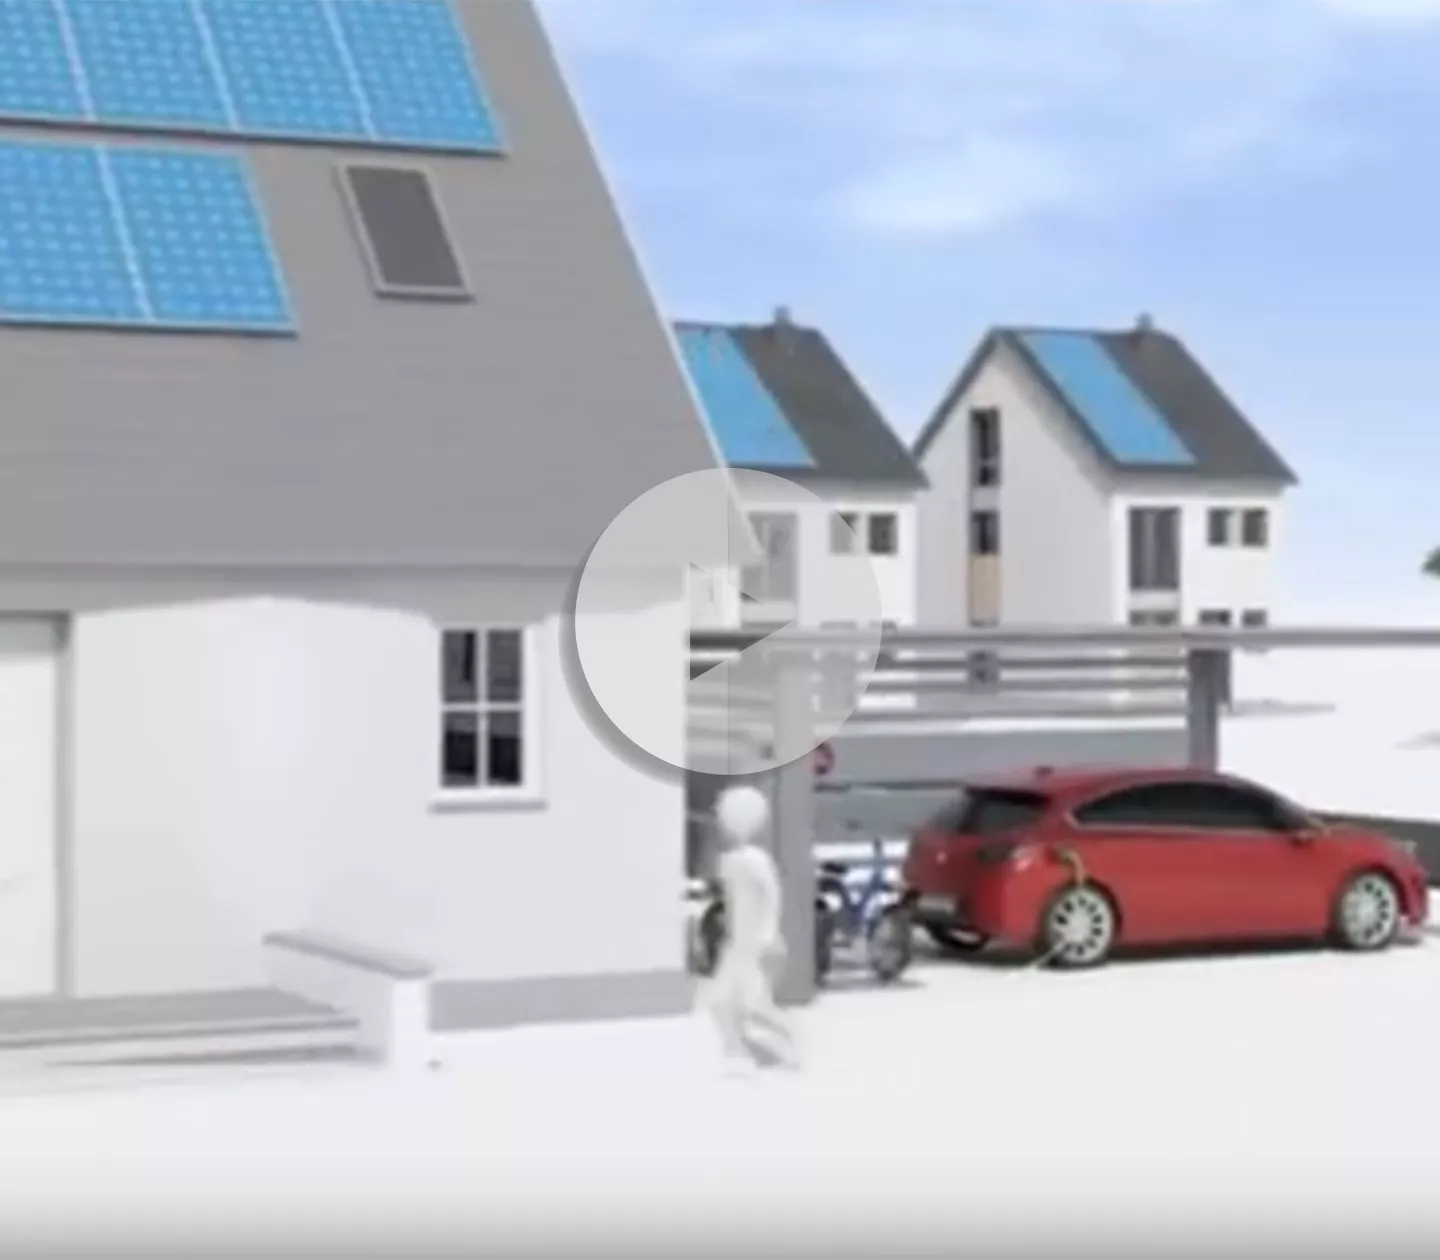
Fronius Datamanager 2.0 comes with a number of open interfaces and functions as standard. Integrating a Fronius Smart Meter into the PV system allows the overall energy flow in the household to be monitored and managed. For example, you can connect a heat pump for your customers and collect data about its energy consumption. Here’s where things start to get really exciting: analysing this data allows you to determine how the PV system can be expanded. It may be worthwhile for your customers to invest in a storage system or heat their water using PV energy.
Integrated interfaces:
WLAN
Ethernet
Modbus RTU SunSpec
Modbus TCP SunSpec
Fronius Solar API (JSON format)
2) USE THE POWER OF WORD OF MOUTH
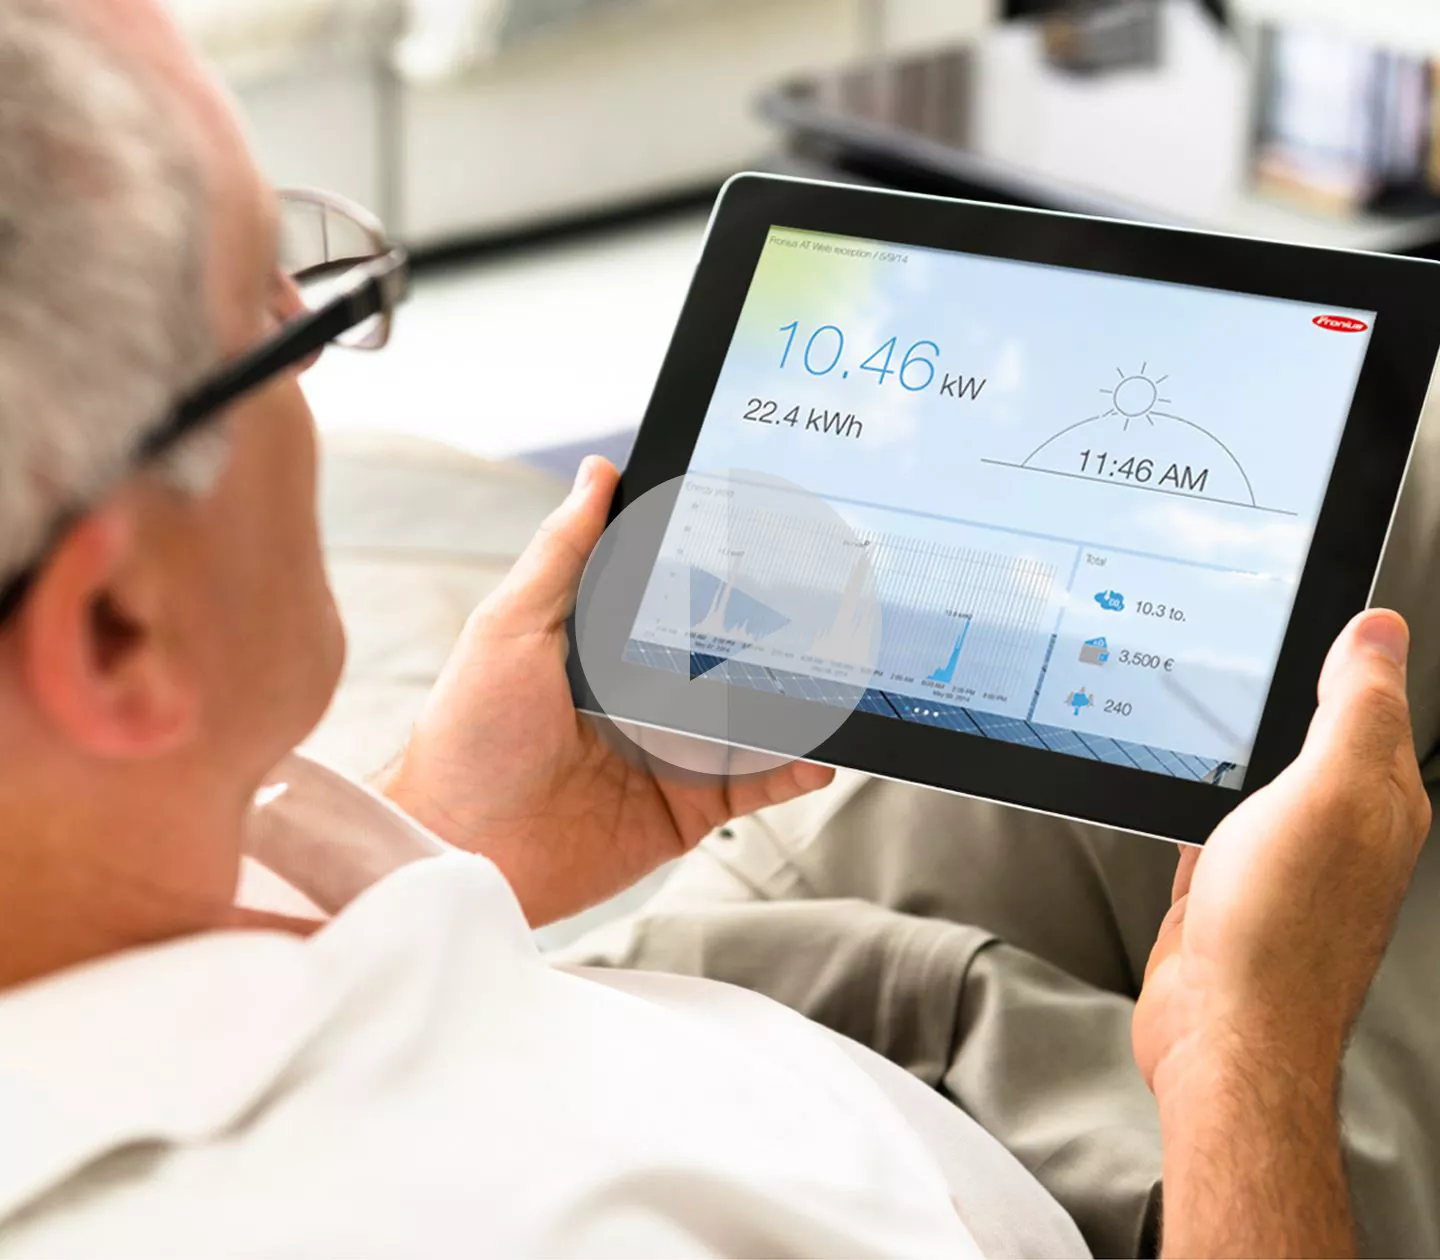
A significant proportion of your customers will monitor their yields closely in the Fronius Solar.web online portal and tell other people about it. As an installer, word of mouth is the best and most cost-effective form of marketing to acquire new customers. If your customers are not using Solar.web yet, encourage them to do so! This will generate new enquiries in the long term.

3) STAY UP-TO-DATE WITH AUTOMATIC NOTIFICATIONS
Fronius Solar.web automatically notifies you if, for example, the PV system registers an error code. This allows you to rectify the fault quickly, thus keeping your customer’s yield losses as low as possible.
4) EASY MANAGEMENT OF SEVERAL SYSTEMS
Imagine that a new version of the inverter software is available. Fronius Solar.web makes it quick and easy to install this update on multiple devices at the same time. And there is no need to travel to the installation site, you can install the update from the comfort of your office. We call this the “Remote Update Function”. We offer this function not just for inverters, but also for other Fronius components, such as the Fronius Ohmpilot. Just think of the money you could save! No travel costs and barely any labour; just a couple of clicks in Solar.web and your customers’ systems are fully up-to-date. Ingeniously simple, isn’t it?
5) SIMPLE SELF-CONSUMPTION DISPLAY
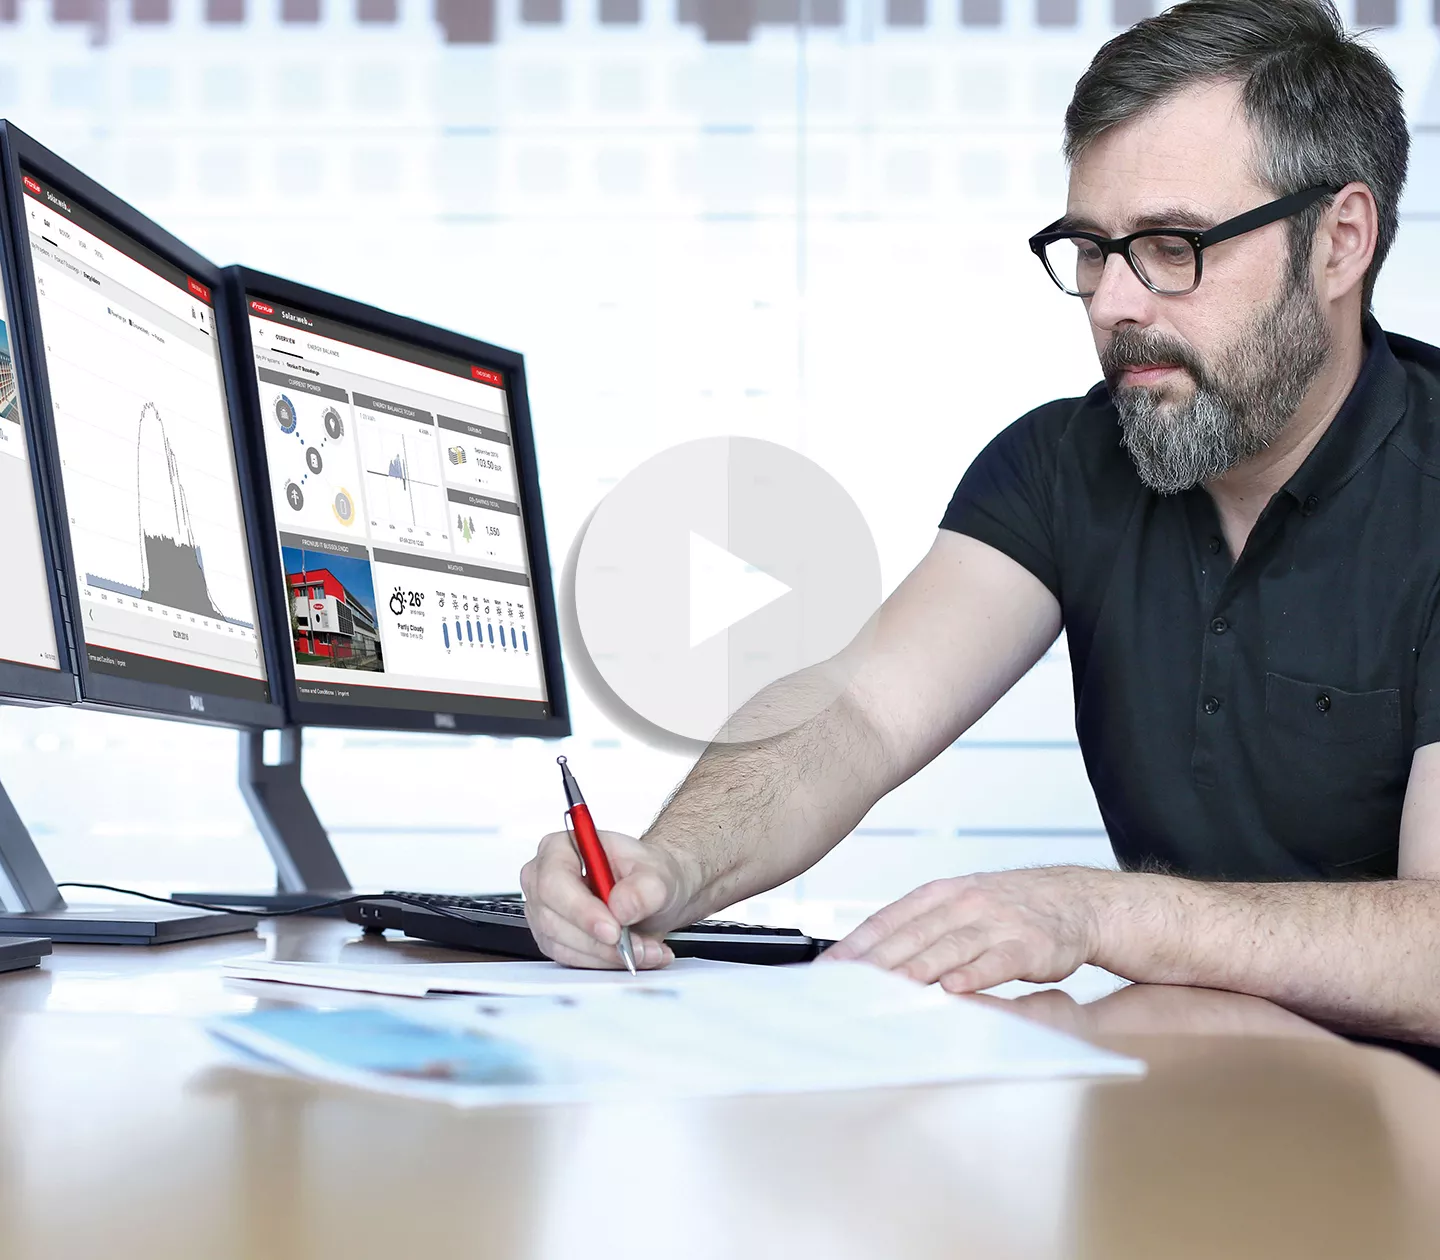
You can view all of your customer’s self-consumption data in Fronius Solar.web, broken down by day, month or the entire year. This information allows you to show your customer the areas in which there is potential for optimisation.
An example:
Your customer’s consumption curve in Fronius Solar.web shows that their heat pump uses a lot of energy in the evening – the customer is obviously not at home during the day and only needs energy to heat hot water in the evening. Without a storage system, most of the energy is fed back into the grid, which does not make a lot of financial sense. You could advise your customer to heat their hot water in the boiler using the Ohmpilot, allowing them to use their own energy and increase their rate of self-consumption. It also takes some of the strain off the heat pump.

6) PERMANENT OVERVIEW OF POWER CONSUMPTION FOR COST OPTIMISATION
The power consumption overview gives you a clear picture of how much energy is required and when. You can use this information to analyse your customer’s consumption behaviour and encourage them to make improvements.
Example:
You notice that your customer has a very high level of consumption during the day, even though no one is at home. They may need to check the energy class of their freezer. It is possible that the appliance is outdated and needs to be replaced with a newer, more energy-efficient model.
7) VISUALISATION AND ANALYSIS OF ENERGY STORAGE SYSTEMS
If your customer already has a storage system installed, this can easily be analysed and the appropriate settings for general use applied.
Example:
Your customer lives in a country where electricity prices are variable. You should therefore set the battery to discharge when the customer requires a lot of electricity and mains current is expensive. If your customer does not have a storage system installed, this would be an area where ongoing cost savings could be made.

8) CSV EXPORT OF SELF-CONSUMPTION DATA
As a Solar.web Premium user, you can export all data in CSV format. This allows you to access the data in other programmes for even more detailed analyses. You can also choose to receive these reports by e-mail automatically.
Fronius Solar.web vs. Fronius Solar.web Premium |
||
| Fronius Solar.web | Fronius Solar.web Premium | |
| Monitoring and analysis of PV data | ✓ | ✓ |
| Automatic reports and notifications | ✓ | ✓ |
| Inverter remote update function | ✓ | ✓ |
| Production and consumption curves on a daily basis** | 3 days | ∞ |
| Individual reports available at any time | - | ✓ |
| Presentation of the PV reality | - | ✓ |
| Yield and cost overview | - | ✓ |
| Prediction of PV production* | - | 2 days |
| Extensive weather indicator* | - | ✓ |
* Currently available for Fronius Solar.web Premium customers in Austria and Germany for one system. Other countries will follow shortly.
** Only possible in combination with a meter (Fronius Smart Meter)
You can find out more about this topic in the White Paper, which is available from the downloads area.